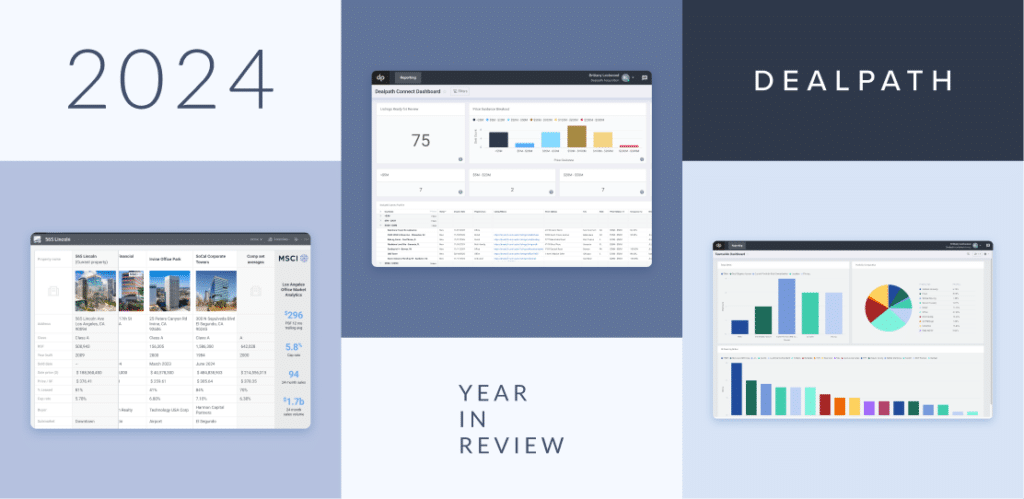
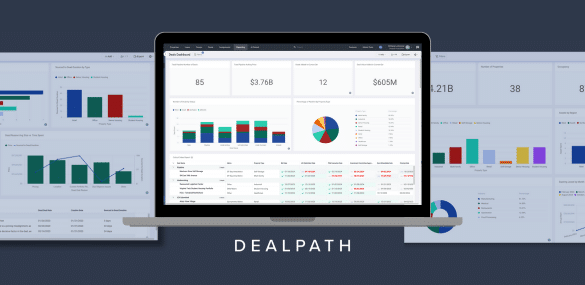
We’re excited to announce today the release of our new dynamic data visualization capabilities.
Purpose-built and designed to empower investment teams, real-time charting delivers actionable insights which are easily displayed and interpreted in group meetings.
This functionality is now live in your account and available for use by clicking here!
We’ve heard and understand how much of your life is spent in pipeline and IC meetings along with the scramble to prepare and update accurate information for productive discussions.
Our new visualization capabilities, along with everything else that we’re building out at Dealpath, are in pursuit of maximizing value of real estate investment and capital markets for you, our clients.
Examples of how high-performing teams are leveraging Reporting Charts
Instantly see your pipeline with the ability to pivot by stage, purchase price, property type, broker (or any other data type). Gone are the days of spending hours compiling data, writing formulas, and doing forensic analysis to ensure accuracy; the information you need is at your fingertips:
 From a different angle, maybe you want to understand staffing and resourcing across the investment team. With Dealpath, you can simply group your deals and clearly see how the team is allocating workload:
 How about distributing formatted hard copies before a meeting? All your information can be exported at any time into a formatted file with your branding – ready for executive leadership and key partners:

With the latest enhancements to our Reporting functionality, clients have the power and control to leverage data for smart investment decisions to deliver optimal risk-adjusted returns.
Can I compare metrics within a specific deal?
Certainly. While the Reporting Charts allow you to visualize trends across all or a subset of your deals, Dealpath users can also create charts within a deal to compare metrics.
From simple data comparisons such as the number of units your portfolio deal has per property, to more technical analyses such as your budget costs summary, our platform allows you to configure Info Charts that can be displayed on every deal.

Want to walk through it with an expert?
Learn more about Dealpath reporting capabilities and how they can transform your investment process today by scheduling a workshop!
Meanwhile, follow us on LinkedIn for the latest updates and perspectives from Dealpath.


