This blog post was last updated on October 11th, 2023.
One lens through which investment managers evaluate a new deal is calculating its commercial real estate cap rate. The commercial real estate cap rate of a property offers a glimpse into the risk and return. This helps investors to understand the deal’s risk profile compared to other similar opportunities in their real estate acquisitions pipeline. In other words, the cap rate illustrates the deal’s potential ROI.
In this blog post, we’ll explain what commercial real estate cap rate means, how to calculate it, and how to amass competitive intelligence in a centralized deal database.
What Does Cap Rate Mean in Commercial Real Estate? (Definition)
The commercial real estate cap rate, or the capitalization rate, is one metric that CRE investors rely on to gauge the risk and potential return rate of an asset or property. Similar to multiples in equity markets, cap rates are measured as percentages, typically from 3-20%. This risk is a measure of the amount of time it takes for an investor to recover their initial investment.
When a cap rate is low, the property has a relatively higher value and lower risk. High cap rates, conversely, indicate that the property’s price is relatively low and will potentially yield high returns—albeit with added risk.
While cap rates offer one perspective on the property’s potential, they won’t necessarily provide value in a vacuum. Instead, cap rates are best used as a comparison metric against similar properties. Tracking cap rates from target markets in a deal management platform also allows your firm to develop competitive intelligence for future benchmarking and decision making.
While cap rates are invaluable, they are not the sole metric investors should rely on. Commercial real estate cap rate doesn’t take mortgage or financing arrangements into consideration, instead assuming a cash purchase. This figure is based exclusively on current rents, without considering external factors like:
- Leverage
- The time value of money
- Improvements or renovations
For this reason, cap rates don’t necessarily capture the property’s full market potential. To make these analyses more holistic, investors also consider other metrics, like the internal rate of return.
Because net operating income changes as rents increase, additional tenants sign, or operating costs fluctuate, cap rates are not fixed.
How to Calculate Cap Rate for Commercial Real Estate (Formula)
How do you calculate the commercial real estate cap rate for a property?
The most common way to calculate a commercial real estate cap rate is:
NOI/Current Property Value= Capitalization Rate
To convert this figure to a cap rate expressed as a percentage, simply multiply by 100.
You can calculate the net operating income by deducting management-related expenses from the annual income generated by the property. These expenses can include both standard upkeep and taxes. The current market value is simply the property’s value given the current market conditions, which you can calculate in a few different ways:
Commercial Real Estate Cap Rate Example
$500,000/$5,000,000=10%
For example, if the property generates $500,000 in income after expenses, and the current value is $5,000,000, then the cap rate is 10%. In other words, the investor is earning 10% of their investment on an annual basis. Because the cap rate is 10%, it will take the investor ten years to recover their initial investment.
|
Values |
Deal #1 |
Deal #2 |
Deal #3 |
|
Net Operating Income |
$500,000 |
$750,000 |
$1,850,000 |
|
Current Property Value |
$5,000,000 |
$9,000,000 |
$12,000,000 |
|
Capitalization Rate |
10% |
8.3% |
15% |
|
Investment Recovery Time |
10 Years |
12 Years |
7 Years |
|
Relative Risk Level |
Medium |
Low |
High |
While you can also find the cap rate by dividing NOI by the purchase price, this method is less reliable. Purchase prices are often out of touch with market trends, especially if the property has undergone significant renovations. This also eliminates considerations about market conditions.
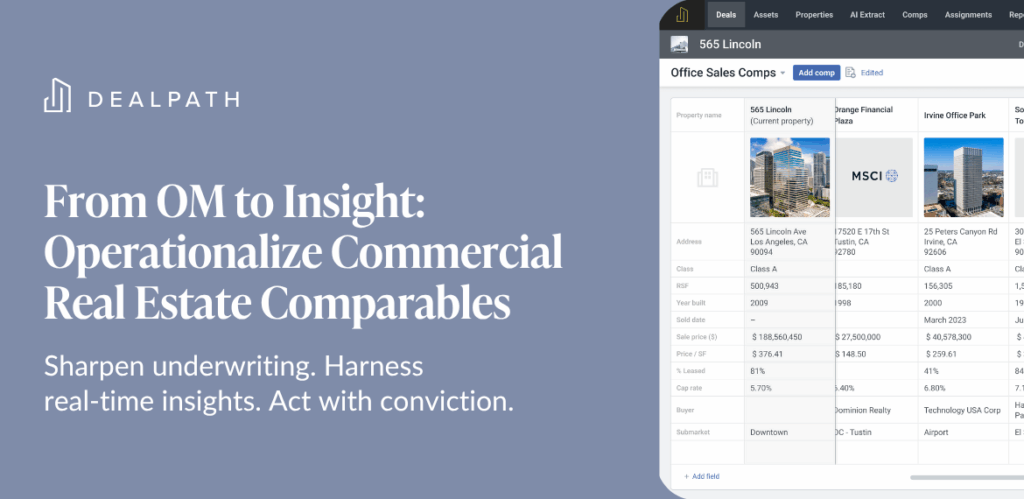
Fortunately, surfacing cap rates doesn’t require extensive research or digging for spreadsheets. Real estate investment management software like Dealpath enables deal teams to slice and dice analytics from a reportable deals database based on cap rates and other data points. The more deals you screen via automated deal ingestion, the more intelligence you can amass for informed decision making.
What Is a Good Capitalization Rate for Commercial Real Estate?
Naturally, the goal of calculating cap rates is to determine whether or not a deal aligns with investment goals. So, what’s a good cap rate?
Unfortunately, there’s no easy answer. Cap rates are best used for market comparisons, rather than isolated evaluations. There are many moving factors that can influence whether or not an investor considers a cap rate “good”.
Rather than examining cap rates in a vacuum, investors typically compare pipeline property cap rates against historical cap rates to determine if the deal pencils. Ultimately, the cap rate will help your firm to understand how the deal aligns with your target risk profile.
For example, a high-risk investor might consider a 15% cap rate in San Diego ideal. Conversely, a low-risk investor might shy away from higher cap rates, opting instead for deals with 5% cap rates that yield lower returns aligned to investor risk profiles.
Average Cap Rate By Property Class
While there may not be a magic number you should strive for across the board, there are benchmarks depending on the property type, class, and location, among other factors.
There are three basic property classes: A, B, and C. While the distinction is subjective, the bottom line is simple. Class A properties are the most expensive and carry the lowest risk. Class C properties, on the other hand, are the least expensive with the highest risk. Finally, class B properties sit in the middle. These distinctions are subject to interpretation, but help create a baseline for evaluation.
According to First National Realty Partners, average cap rates by property class are:
- Class A: 4-8%
- Class B: 6-9%
- Class C: 7-10%
As previously mentioned, though, these figures can vary significantly based on the location and the asset class. For example, multifamily properties may have lower cap rates than office buildings on average, as they are generally lower-risk investments.
Why Is a High Cap Rate Riskier Than a Low One?
Despite offering the potential for higher returns assuming ideal conditions, high cap rates are riskier due to greater volatility. This risk, or the perception of risk, can stem from a less-than-ideal location, low demand, high operating costs, low income, and other factors.
What Are Cap Rates In 2023?
It’s impossible to generalize on cap rates in 2023, as this metric is informed by factors related specifically to a particular asset.
However, many property types and markets have seen an increase in cap rates due to ongoing turbulence and high interest rates. According to an H1 CBRE report, multifamily and retail cap rates are trending upward, while office saw the most significant increase.
What Factors Affect the Cap Rate?
Overall, the commercial real estate cap rate is a representation of the property’s potential risk and return. Some of the factors that influence the cap rate are:
- The length and rate of existing leases: Unlike properties with short-term leases, properties with long-term leases are guaranteed to generate consistent income for a longer period of time. Properties with shorter leases may lose income streams sooner, which results in higher risk. On the opposite side of the coin, leases below market rent value that are set to expire soon may be increased to meet current market standards, raising NOI.
- Credit scores: Tenants with lower credit scores are typically at a higher risk of defaulting on their lease. For this reason, portfolios with higher-credit tenants face a lower risk of default, lowering cap rates.
- Location: Properties that are located in larger urban centers, like New York and San Francisco, generally have higher prices than properties in smaller cities like Minneapolis. Given the higher selling prices, cap rates in larger cities tend to be lower.
- Replacement cost: When a building is valued at or below the cost of developing a comparable property, it generally has a lower cap rate. Conversely, properties valued above the replacement cost have a higher cap rate.
- Property type: Various property types have different levels of risk associated with them. Filling vacancies in multifamily properties is often easier than those in other asset classes like office buildings, meaning cap rates are lower.
- Property class: As outlined above, property classes are broken down based on the building’s state, implied risk and location. Class A buildings, which are more valuable and carry lower risk, have lower cap rates than class C buildings, which are less valuable and carry higher risk.
- Market conditions: A price dislocation can create turbulent market conditions, lowering property valuations and increasing cap rates.
Understanding The Purpose of Cap Rates: What Do They Tell You?
Cap rates provide investors with insight into the risk they take on in purchasing it, as well as the return it could generate. Most importantly, cap rates act as a crucial benchmark for investors to compare against other assets on the market.
Comparing Purchase Prices on Pipeline Acquisitions
All investment decisions must be grounded in data. Commercial real estate cap rates provide tremendous insight into risk and return, as well as market trends. Comparing cap rates in the same market prior to an investment helps investors understand how a property stacks up against historical comps, too.
Low cap rates indicate that properties will generate healthy income streams relative to their market value. High cap rates, on the other hand, indicate a higher-risk acquisition, without as much income compared to cost. However, one isn’t necessarily better than the other–investors with different strategies act on unique criteria based on their risk profiles.
Considering Refinancing Options on Existing Assets
Because cap rates provide an (albeit limited) indication of a property’s value, they can be useful in considering refinancing. When investors are looking to save money by restructuring mortgage agreements, cap rates can indicate the property’s value through the loan-to-value evaluation. This offers visibility into if refinancing is possible, and the extent to which it can offset repayment costs.
Understanding Terminal (Exit) Capitalization Rates: Projecting Sale Value
Beyond immediate operating income from rents, investors also consider the long-term return of a property. Financial models can help investors predict a property’s value at the time of sale, or disposition, after development or at the end of the holding period.
While terminal cap rates accomplish the same basic function as standard cap rates, the formula is different. Instead of using the current market value, you can divide NOI by the expected sale price to calculate the exit cap rate.
Tracking exit cap rates in one source of truth is critical for delivering risk-adjusted returns, particularly in an uncertain market.
Cap Rate Vs. ROI
Both the cap rate and the return on investment, or ROI, are valuable financial benchmarks that guide investment decisions. Where cap rates indicate relative risk levels, though, the return on investment actually quantifies the return that you can expect. For this reason, ROI is more valuable when projecting annual or quarterly returns, while cap rates are better for comparative benchmarking.
17 CRE Investment Questions Your Data Can (Finally) Answer
In today’s AI-powered market, investment managers must move at digital speed and make informed, data-backed decisions.
Download our white paper to learn how your firm can rapidly answer questions about cap rates, lender exposure, and more to outperform competitors with data at its fingertips.


