Comparing a prospective investment against historical benchmarks helps provide essential context as investors review new opportunities. While not a primary method of valuing real estate like the income or cost approaches to appraisal, a property’s price per square foot can indicate if the price is in line with historical comps in the same market. Read on to learn how you can calculate the price per square foot on a commercial property, as well as how you can track and leverage this metric.
How to Calculate Price Per Square Foot
To calculate the price per square foot for commercial real estate, follow the formula below:
Commercial real estate price per square foot=Property price/square footage
The general purpose and approach behind this formula is consistent across asset classes. To best understand the property’s value for certain property types, though, it often makes sense to substitute the size for units. As a hotel or hospitality investor, calculating the price per unit might be more insightful than the cost per square foot, as this directly affects potential revenue. Retail investors looking to purchase single-tenant buildings, though, will always find the cost based on square footage most valuable.
Provided you have access to the property’s price and size, you can determine the price per square foot with ease. Firms without centralized data, however, may find it more difficult to compare the price PSF against similar properties. We’ll detail how firms accomplish this quickly and systematically later on in this post.
The commercial real estate price per square foot is best used as a comparative benchmark, rather than a primary method of valuation.
Example of Commercial Real Estate Price Per Square Foot
To better understand how to calculate commercial real estate price per square foot, let’s dive into an example for a Class B industrial property in San Diego, California. Assume that the 37,000 square foot property you’re evaluating costs $12 million, and that you’ve evaluated similar properties in recent months:
| New deal | Historical deal 1 | Historical deal 2 | Historical deal 3 | |
| Size in Square Feet | 37,000 | 45,000 | 35,000 | 48,000 |
| Price | $12,000,000 | $18,000,000 | $11,500,000 | $15,500,000 |
| Price per square foot | $324 | $400 | $328 | $322 |
After dividing the price by the square footage, it’s clear that the price per square foot for this deal is $324. Based on historical data, we can see observe that:
- Historical building 1 is larger than the current deal, but has a much higher price per square foot than the other two comps, which means this might be an anomaly
- Historical building 2 carries a similar price per square foot, as well as a similar price
- While priced $3 million higher than the current deal, historical building 3 actually has a lower price per square foot at $322
Simply put, this data confirms that the current deal is in line with the available market comps. Naturally, this is only one small step in a lengthy vetting and evaluation process, including due diligence. This data does, however, indicate relatively standard market rates based on historical comps.
What Does the Price Per Square Foot for Commercial Real Estate Mean?
Depending on your goals and methodologies, commercial real estate price per square foot could indicate a number of different things. This metric is intended for comparisons, rather than an isolated analysis. At the most basic level, the price per square foot helps equity investors determine if acquisition deals are similar to others in the same market. Developers, on the other hand, might use this metric to assess if a prospective project will yield qualifying returns based on fully developed properties.
It’s also important to factor in the source of the property’s price. For example, utilizing the price derived from the cost approach can have different implications than the price sourced from the income approach. Additionally, both of these would yield different insights than the price from the property flier.
Leveraging Technology to Effectively Compare Deals
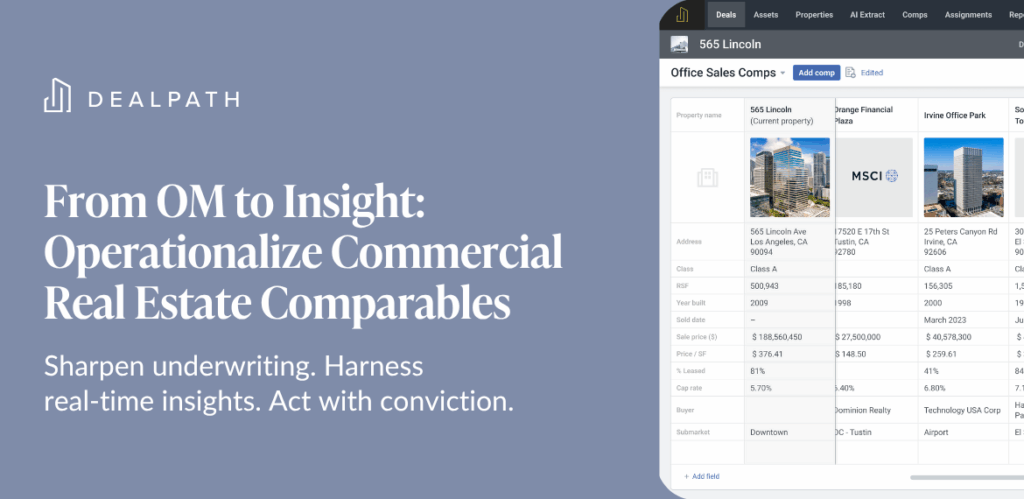
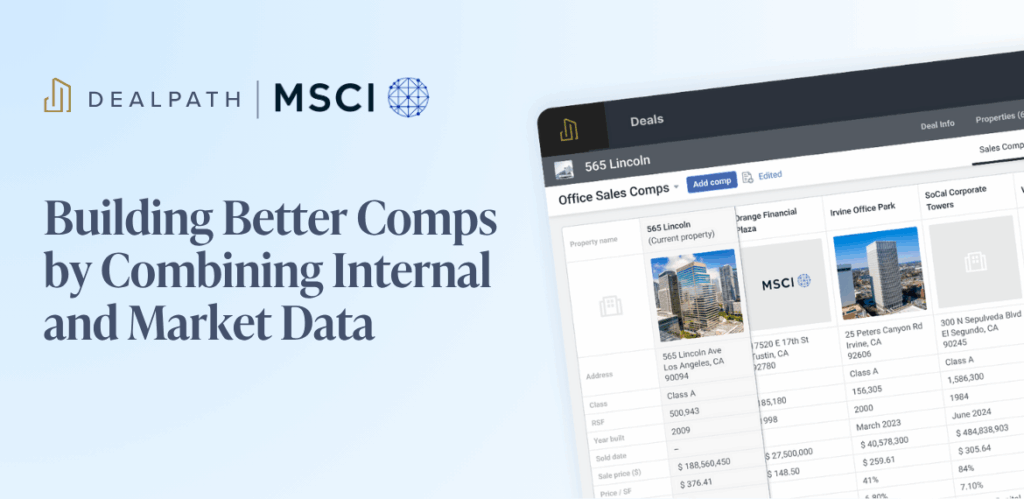
To learn from the price per square foot, investors must have similar properties to compare it against. Institutional investors have no shortage of historical data on hand, but accessing and utilizing it often involves sifting through spreadsheets for data that might be outdated.
With historical deals and data tracked in Dealpath, your team can access the insights required to review new deals at scale without spending valuable time requesting information–or worse, making decisions based on old data.
Overcoming Operational Inefficiencies to Scale Deal Vetting & Analysis
Without purpose-built technology, locating the data you need to dive deeper into new deals can take valuable time that’s better spent on deal execution. Download our white paper, 5 Operational Inefficiencies That Slow Deal Flow (And How to Solve Them), to learn how your firm can expedite and optimize internal processes to grow its top line.
Download White Paper


